tldr: India advances as far as it can with poor property laws and limited energy production capacity and the metrics show it.
Piyush Vedprakash Goyal (born 13 June 1964) is an Indian politician who is serving as Minister of Commerce and Industry since 2019.
"What are India startups of today—we are focused on food delivery apps, turning unemployed youth into cheap labour so the rich can get their meals without moving out of their house." - Piyush Goyal
I believe Piyush's view is short sighted and lacks insight into the manner in which countries develop.
Always remember, Tesla put its semiconductor office in India. Not in Israel or Taiwan. My retort to Piyush Goyal's claims. The tweet.
Remember this one fact about India - India doesn't have viable property rights and sits at below 2 MWh/capita annum.
Furthermore, some other key things to understand about India:
Has ~250 languages and no manageable single operating language. Lee Kuan Yew brings this up in conversation here.
1/3rd the size of the USA but has 4x the population.
India lacks the energy production capacity to make full use of its indigenous engineering population and as such the talent is exported abroad and the results manifest themselves as remittances which make up ~3.3% of the country's GDP.
The lack of viable property rights:
Weak Property Rights Documentation Limits Collateral Use: Over 60% of India’s rural and urban properties lack clear titles or formal registration, affecting ~500 million people (World Bank, 2020). This restricts collateral-based borrowing, with only 5% of MSMEs accessing formal credit due to unverifiable assets, constraining economic growth.
Lending Constrained by Information Asymmetry: With ~90% of land records outdated or disputed in states like Bihar and Odisha (NCAER, 2018), banks face high risks, leading to a credit gap of $400 billion for MSMEs (IFC, 2021). This limits lending, as non-performing assets in property loans reached 8.8% in 2023.
Securitization Hampered by Legal Uncertainties: India’s securitization market is underdeveloped, with asset-backed securities forming <2% of total credit (RBI, 2022). Unclear titles reduce viable collateral, with only ~10% of properties meeting SARFAESI Act recovery standards, stalling $100 billion in potential securitized assets.
Bankruptcy Resolution Slowed by Property Disputes: Property-related delays affect 70% of bankruptcy cases under the IBC, with average resolution times exceeding 600 days against a 330-day target (IBBI, 2023). This impacts $50 billion in stuck assets, deterring creditors and investors.
Court Systems Overwhelmed by Property Litigation: Over 25 million property dispute cases clog India’s courts, accounting for 66% of civil litigation (Daksh India, 2022). This backlog, with cases lasting 5-10 years on average, delays $200 billion in disputed assets, undermining lending and bankruptcy processes.
I'm an investor in Landeed - which is involved in property rights stuff in India.
MSME - stands for Micro, Small, and Medium Enterprises.
Sub 2 MWh/capita annum
Low energy access, defined as less than 2 MWh per capita per annum, significantly hampers modernization across multiple sectors in a country, particularly in India, where property rights issues exacerbate inefficiencies.
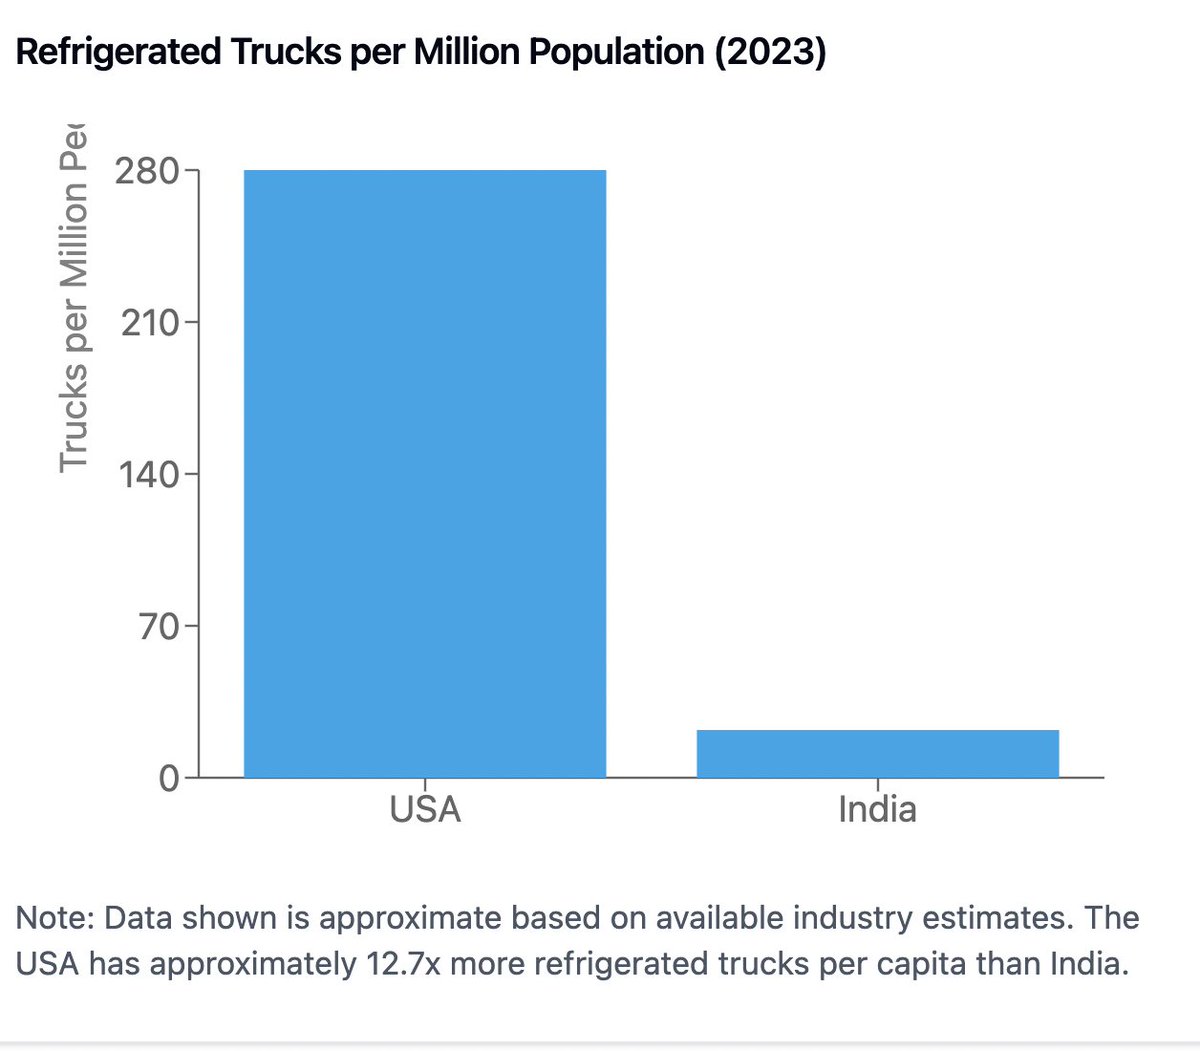
Refrigerated Cold Chain Stunted, Worsening Food Loss: With <2 MWh/capita, India’s cold chain infrastructure is severely limited, covering only 10% of perishable produce (FAO, 2021). This leads to 17% of food production (92 million tonnes annually) lost post-harvest due to inadequate refrigeration (UNEP, 2021). Unclear property titles hinder investment in cold storage facilities, as landowners cannot easily use land as collateral, stalling modernization of supply chains.
Food Waste Amplified by Energy Constraints: Low energy access restricts processing and storage, contributing to 30-35% of India’s agricultural produce (worth $14 billion yearly) being wasted (ICAR-CIPHET, 2015). Without reliable power, 50% of rural markets lack proper storage, exacerbating spoilage. Weak property rights delay land acquisition for waste processing plants, slowing adoption of modern waste-to-resource technologies.
Fewer Farmers Benefit from Mechanization: India has 140 million farmers, but <2 MWh/capita limits electrification of farms, with only 20% using mechanized tools (NSSO, 2019). This keeps yields low (e.g., 2.5 tonnes/hectare for rice vs. 4 globally). Insecure land titles restrict access to credit for equipment purchases, as banks reject 60% of loan applications lacking clear collateral, hindering agricultural modernization.
Farm Tool Production Lags, Raising Costs: Low energy availability curbs farm tool manufacturing, with India producing 70% fewer mechanized implements per capita than China (FICCI, 2020). This forces 80% of small farmers to rely on manual tools, inflating labor costs by 30%. Property disputes delay factory land approvals, with 25% of industrial projects stalled by litigation, slowing tool supply chains.
Poor Roads and Waste Management Delay Modernization: Energy shortages limit infrastructure development, with 40% of India’s 6.4 million km road network unpaved, delaying produce transport by 20-30% (MoRTH, 2023). Waste management is primitive, with 70% of 150,000 tonnes/day of municipal waste openly dumped due to insufficient processing facilities (CPCB, 2022). Unresolved land ownership disputes block 15% of road projects and 30% of waste plant sites, perpetuating inefficiencies.
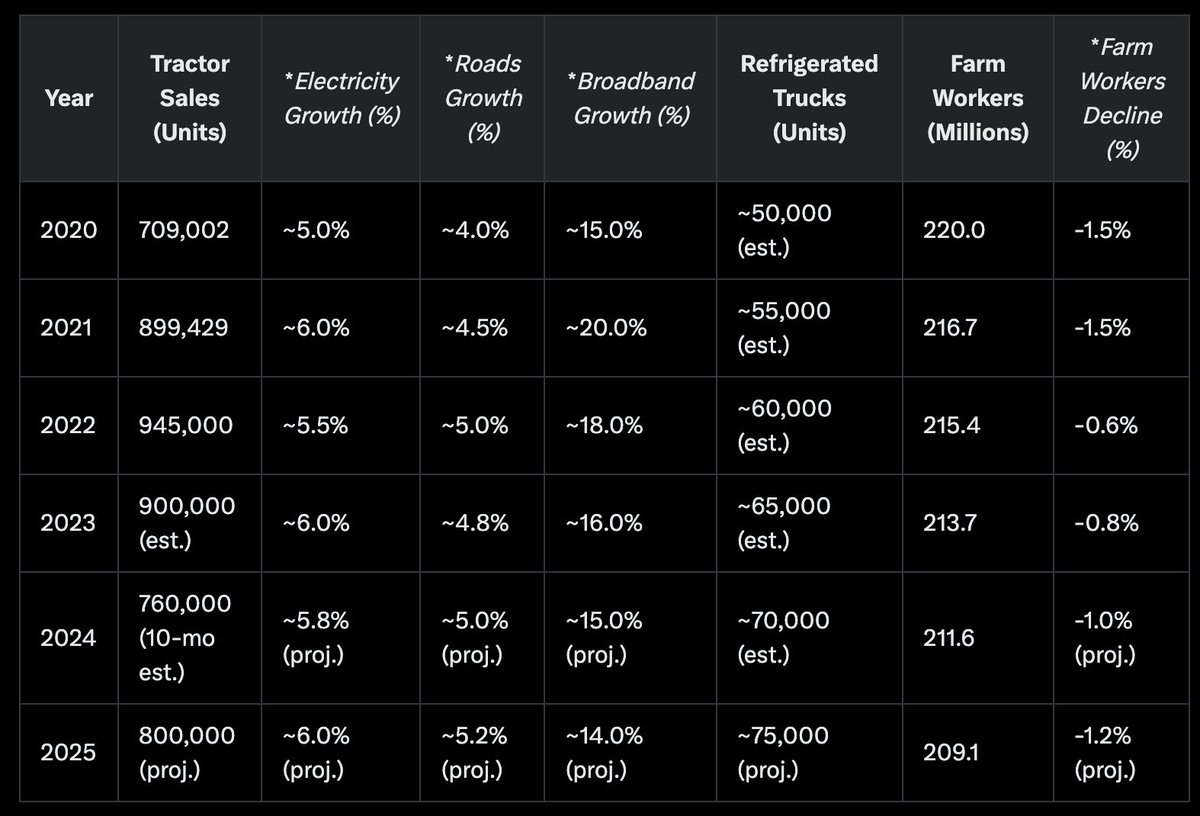
These constraints are damning but not immovable. Note the following trend.
Note the decrease in ag workers by 1M-2M people each year. It correlates tot he sale of ~1M tractors/yr.
One of the most important metrics to a country's advancement is the energy return on investment.
The ways for countries to achieve high energy return to investment are to put policies in place that enable the following:
Building Density
Policies that promote high-density construction to optimize infrastructure and reduce per-capita energy costs.
Incentivize Dense Construction: National Urban Policy Framework (NUPF) 2018 - Revises zoning for high-density projects; lowers telecom energy costs 25% per user, adds 10 million urban homes by 2030.
Increase Floor Area Ratio/Floor Space Index: Mumbai Development Plan 2034 (MDP 2034, 2018) - Relaxes Floor Area Ratio/Floor Space Index (FAR/FSI) caps for denser buildings; boosts telecom efficiency 20%, accommodates 2 million residents by 2034.
Land Pooling Plans: Delhi Land Pooling Policy (DLPP) 2018 - Enables dense urban extensions; saves 20% telecom build energy, adds 1.2 million homes by 2035.
Mandate Green Buildings: Energy Conservation Building Code (ECBC) 2017 - Enforces net-zero designs; lowers building energy 30%, covers 50% new urban builds by 2030.
Streamline Approvals: Maharashtra Online Building Permit System (MOBPS) 2016 - Uses single-window clearances; cuts project delays 50%, saves 0.3 terawatt-hours (TWh) idle energy yearly.
Encouraging Telecom and Broadband Proliferation
Policies that expand fiber optics, 5G, and Fixed Wireless Access to improve connectivity and EROI.
Subsidize Fiber Optics: Broadband Equity, Access, and Deployment (BEAD) Program (2021) - Offers grants for fiber in underserved areas; cuts energy use by 70% vs. copper, connects 20 million+ unserved homes by 2030.
Streamline 5G Permits: Right of Way (RoW) Rules 2016 - Simplifies small-cell approvals and enforces “dig once” laws; reduces construction energy by 30%, speeds deployment by 6-12 months.
Promote Fixed Wireless Access: National Digital Communications Policy (NDCP) 2018 - Funds Fixed Wireless Access (FWA) pilots for last-mile connectivity; saves 50% trenching energy, reaches 100 million homes by 2026.
Support Shared Infrastructure: BharatNet Phase II (2017) - Encourages neutral-host fiber/5G networks; reduces duplicate builds by 40%, saves 2 million tons of carbon dioxide equivalent (CO2e) yearly.
Integrate Smart Grids: Smart Cities Mission (SCM) 2015 - Links telecoms to smart grids; optimizes energy use 15%, saves 0.8 terawatt-hours (TWh) across networks yearly.
Train and High-Speed Train Infrastructure
Policies that support rail and high-speed rail to reduce energy-intensive transport and enable dense urban nodes.
Transit-Oriented Development: Delhi Master Plan 2021 (DMP 2021, 2017 amendments) - Offers FSI bonuses near transit hubs; cuts sprawl energy 25%, supports 1.5 million residents in Transit-Oriented Development (TOD) zones.
High-Speed Rail Development: National High Speed Rail Corporation Limited (NHSRCL) Policy 2017 - Funds Mumbai-Ahmedabad High-Speed Rail; reduces transport energy 40% vs. cars, serves 1.6 million passengers annually by 2028.
Note: The original list included TOD but lacked direct high-speed rail policies. I’ve added NHSRCL, enacted in 2016, as it aligns with EROI by promoting efficient transport and dense urban nodes for telecom integration.
Natural Gas Pipeline, Compressed Natural Gas Vehicle, and CNG Station Infrastructure
Policies that expand natural gas infrastructure to lower energy costs and emissions.
Expand Natural Gas Pipelines: City Gas Distribution (CGD) Policy (2016) - Promotes pipeline networks for urban gas supply; cuts energy losses 15% vs. LPG transport, serves 50 million households by 2030.
Promote Compressed Natural Gas Vehicles: Faster Adoption and Manufacturing of Electric Vehicles (FAME) India Phase II (2019, includes CNG) - Subsidizes Compressed Natural Gas (CNG) vehicles; reduces fuel energy use 20% vs. diesel, adds 0.5 million CNG vehicles by 2025.
Build CNG Stations: Petroleum and Natural Gas Regulatory Board (PNGRB) Guidelines 2018 - Streamlines CNG station approvals; saves 10% distribution energy, expands to 10,000 stations by 2030.
Note: The original list didn’t cover natural gas. I’ve included CGD, FAME II, and PNGRB policies, all post-2015, as they enhance EROI by replacing less efficient fuels, supporting dense urban energy systems.
How to Compare this to the USA and China.
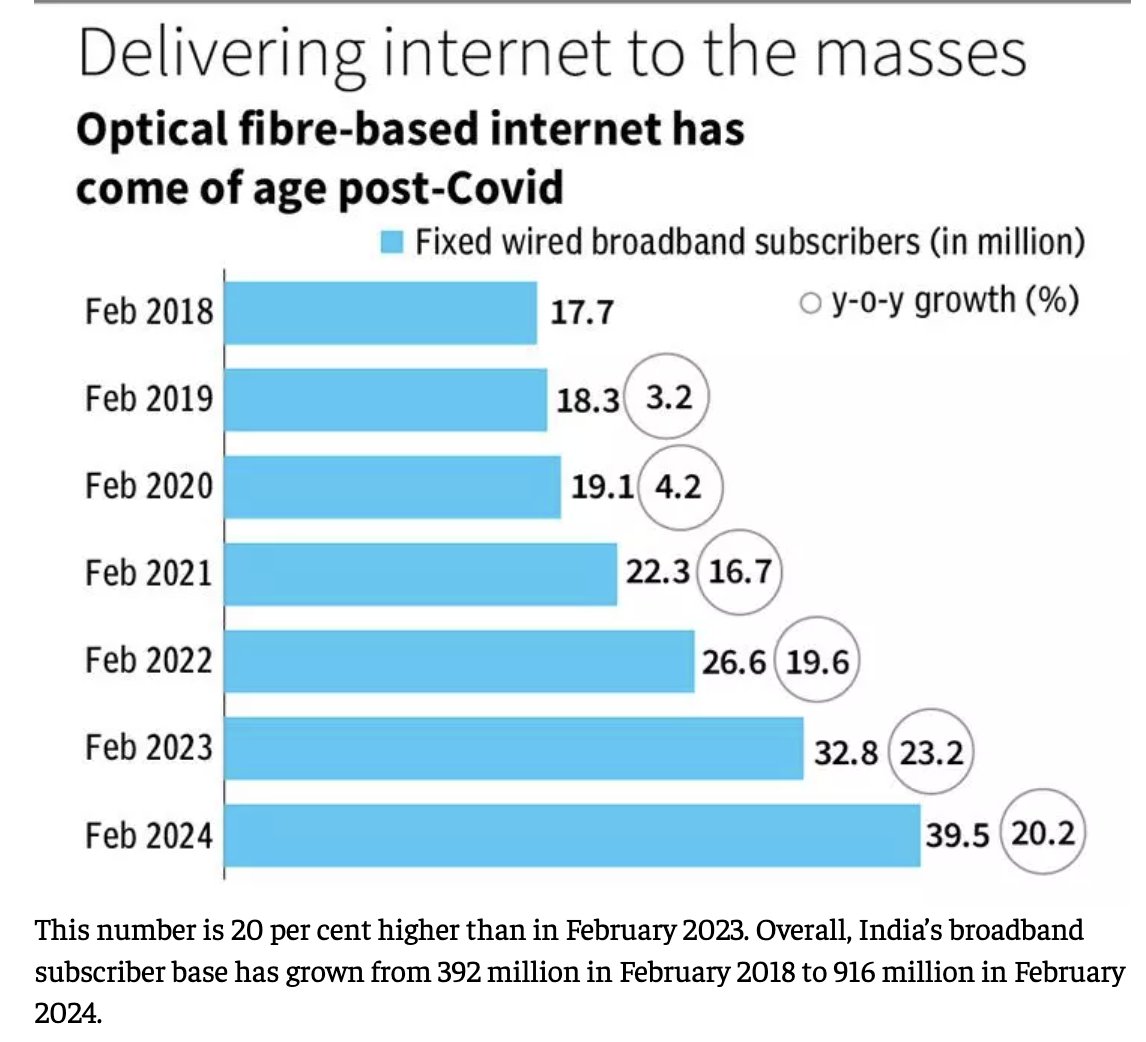
India does some of these better than others. The notable one is encouraging telecom and broadband expanism. It used to take over 400 days to permit for fiber. Now it takes 7 days or less with 100,000 kilometers a month worth of new fiber optic installed.
In comparative terms, India is largely succeeding with some definitive bumps along the way.
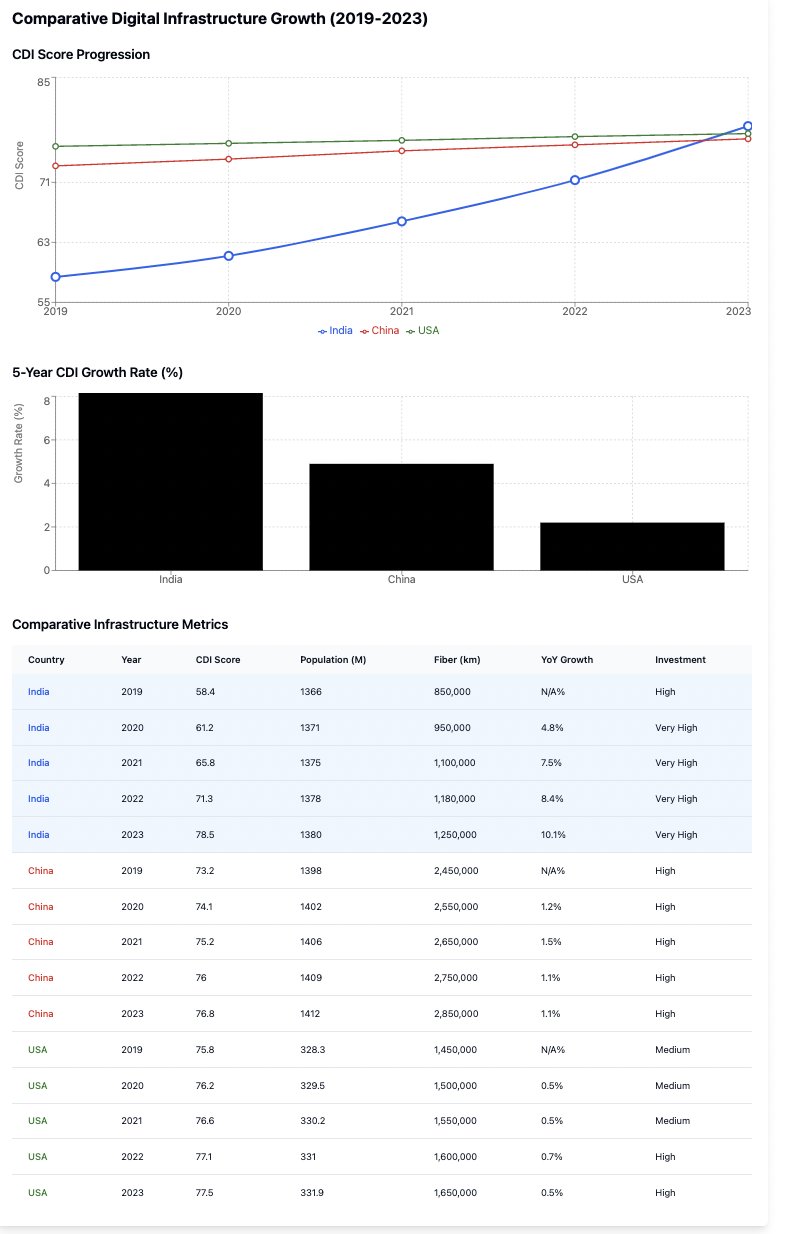
I generated a global connectivity density index (CDI) that ingests metrics on fiber optic cable, population, and total land area by country.
In the 2nd one, I do the same but calculate the CDI with energy per capita metrics as well.
I used a geometric mean to combine the 3 metrics (then 4 with energy) and then a logarithmic scale to handle a wide range of values. I focused on balancing both coverage (fiber density) and availability (fiber per capita) and also took into account the challenges of serving different population densities. The Inflection Point is 7-14 years away.... My best gut feeling is that because of India leapfrogging and taking advantage of its density, cheap labor, and large STEM talent.... to feel modernlized like China or the USA- India only needs 2.5.-3.5 MWh/capita annum.
At the current of 1.4 MWh/capita annum and growth rate of ~7%/yr in energy production, India will take ~7 years to feel westernized in terms of infrastructure.
With India, we always take the best estimates and double it. So let's say it's somewhere between 7-14 years and if property law improves, then we could have the great leap sooner.